>> CLICK HERE TO A more detailed description of OpenDX
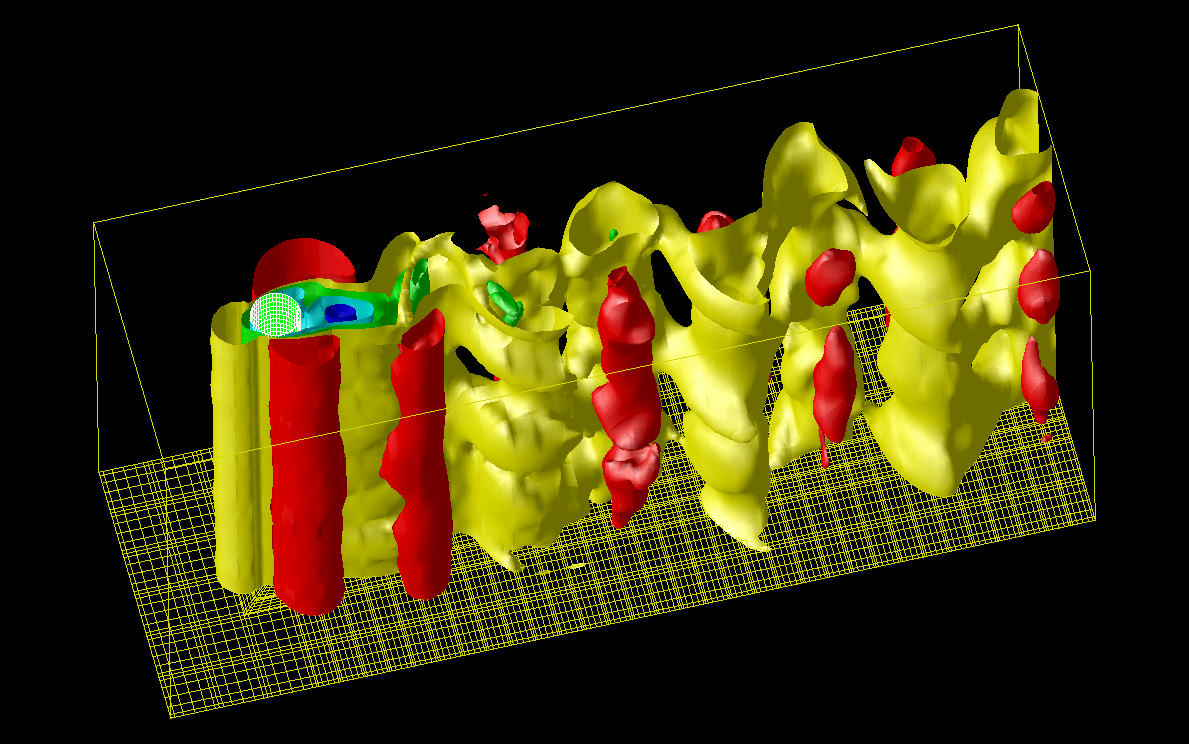
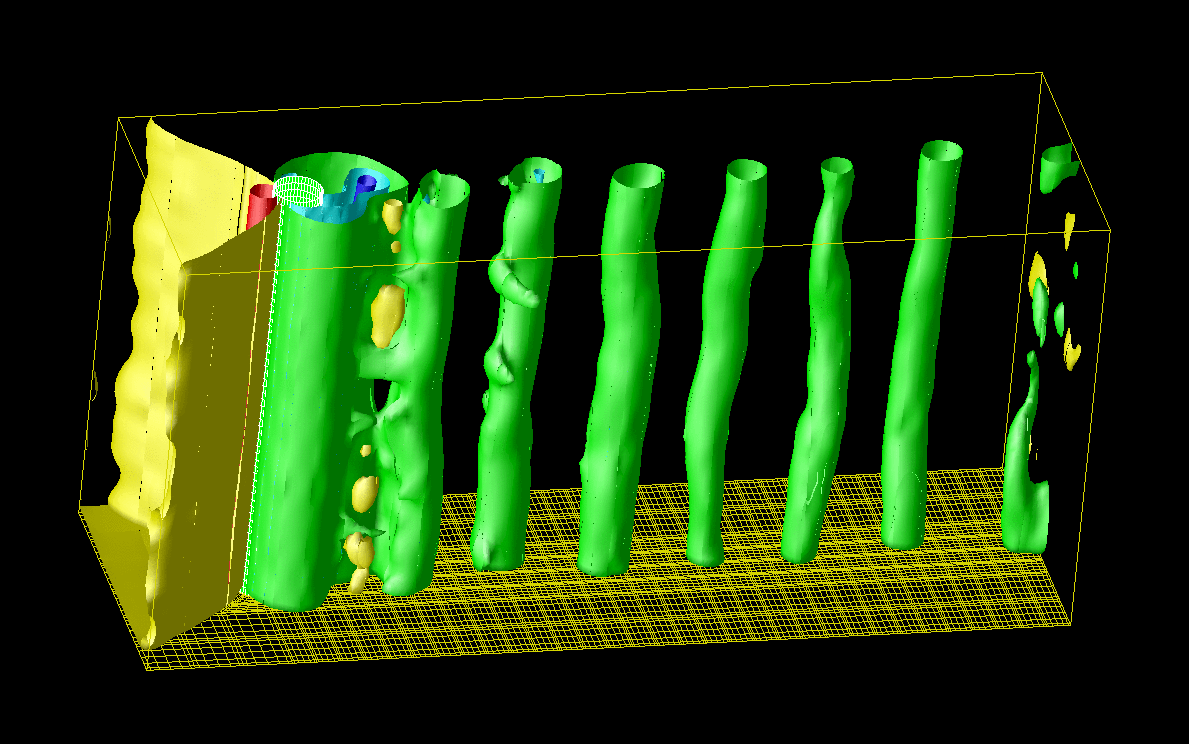
In the spectral element simulation, the data is well structured element by element, hence OpenDX is suitable to visualizing the spectral Element simulation of fluids problems. The following is an example:
![]() data.tar.gz
>>
DOWNLOAD the simulation data
data.tar.gz
>>
DOWNLOAD the simulation data
![]() SEM_dx.tar.gz
>>
DOWNLOAD the OpenDX application
SEM_dx.tar.gz
>>
DOWNLOAD the OpenDX application
Visualization results on the 3D wake simulation behind the cylinder:


![]() JML16.tar.gz
>>
CLICK HERE to DOWNLOAD the open software
JML16.tar.gz
>>
CLICK HERE to DOWNLOAD the open software
![]() JML16.tgz
>>
or CLICK HERE
JML16.tgz
>>
or CLICK HERE
![]() vkarman.dat.gz
>>
DOWNLOAD a simulation data
vkarman.dat.gz
>>
DOWNLOAD a simulation data
![]() README
>>
how to use this program
README
>>
how to use this program
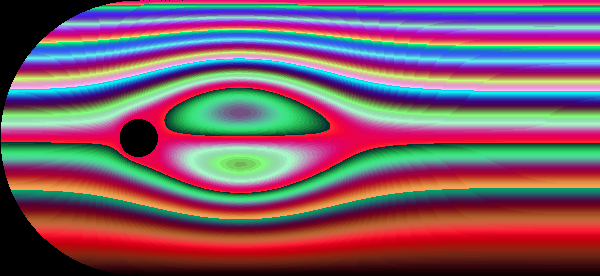
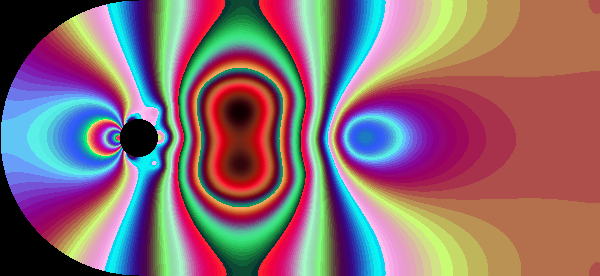
Visualization results on the 2D wake simulation behind the cylinder:

